|
|
|
Firebots: Autonomous Fire Detecting Robots |
|
4th Year Mechatronics Design Project |
|
|
|
|
|
|


|
PATENT #1 - FIRE DETECTION AND EXTINGUISHMENT SYSTEM PATENT #2 - FIRE DETECTION SYSTEM WITH IR AND UV RATIO DETECTOR PATENT #3 - SYSTEM AND METHOD FOR WLAN SIGNAL STRENGTH DETERMINATION PATENT #4 - LOCATION OF WIRELESS NODES USING SIGNAL STRENGTH WEIGHTING METRIC EUCLIDIAN DISTANCE LOCATION DETERMINATION ALGORITHM MONTE CARLO LOCATION DETERMINATION ALGORITHM DESIGN OF MANUAL PLACEMENT ALGORITHM DESIGN OF INTERFACE TO MONTE CARLO LOCATION DETERMINATION ALGORITHM GLOBAL PATH PLANNING – WAVEFRONT APPENDIX A – PCBOT PHYSICAL SPECIFICATIONS
|
Abstract Loss due to fire damage has always been a major area of concern for both industrial and residential areas. After performing more in depth research, it was identified that the US Navy has had an increased demand for improved fire detection technology in order to reduce costs incurred due to fire damage and false alarms [1]. A formal needs assessment was carried out in order to determine the design requirements of such technology. Through a problem formulation procedure, it was determined that the use of an autonomous robot equipped with advanced fire detection technology can minimize costs, reduce false alarms, and be highly extensible to other industries. The design of this system was broken down into three main components: navigation, localization and fire detection. For the localization process, during the Initial Training Phase, two techniques are considered. The first, Manual Placement, involves recording Wi-fi Access Point Signal Strengths and LASER sensor values at location spaced by 1m intervals in both horizontal and vertical direction on the area to map, during ‘offline’ mode when the fires are not being detected. The second technique, Gaussian Process Regression, involves heavily computational stochastic calculations while the fire-detection is also going on, in ‘online’ mode. Since Gaussian Process Regression requires significant processing power and may interfere with fire-detection process, Manual Placement was chosen as selected technique. For Location Determination, two algorithms: Euclidean Distance and Monte Carlo were considered. Monte Carlo algorithm is able to give position information within an accuracy of 0.5m, as opposed to 1m. Since the desired accuracy is 0f 1m, Monte Carlo algorithm was chosen.
Navigation can be subcategorized into Global and Local Path Planning. Global path planning involves finding the most optimal path (in a known environment) from one point to another. Local path planning involves performing fast, real-time obstacle avoidance. The vector field histogram (VFH) algorithm is selected for as the local path planner due to its speed, efficiency and local path optimality. The Wavefront algorithm was chosen as the global path planner since it is computationally efficient and offers optimal global paths. The latest high-end fire detection technology was researched in order to determine which sensor types produce the most accurate results. A variety of lower-end and higher-end sensors were grouped together in sensor packages, and evaluated based on a set of cost and performance criteria. Resultantly, a sensor suite was selected that is comprised of a high-end NetSafety Triple IR flame detector, a USB nightvision web camera, a Hamamatsu UVTron flame detector, and a combination photoelectric-ionization smoke alarm. The web camera is to be used with a custom built vision system using open source vision libraries. A method of detecting smoke and flames through video is also described with reference to recent research done on the matter. These sensors readings are all to be evaluated in parallel in order to have built in redundancy when deciding to sound a fire alert. This enables the reduction of false alarm signals, and allows for the detection of most common fires (class A fires) in the most common locations. Lastly, this system fell within our cost criterion of $5000/unit as the total system costs less than $4000. 1
Introduction
1.1
Background
1.2
Needs Assessment
1.3
Problem Formulation
1.3.1
Objectives
The overall goal of this project is to develop an autonomous early fire detection mobile robot system that is capable of identifying fires at early stages, alerting fire personnel, and reducing false alarms. There are three subcomponents of this project that will identify more specifically the goals and objectives with respect to each component. For the navigation of the robots, the goal is to allow for full navigation of the given area as quickly as possible via the most optimal path while avoiding obstacles. The objectives here are to cover 90% of the (accessible portions of the) pre-specified area, at a minimum average speed of 500cm/s per robot, and to avoid 100% of any static/dynamics obstacles. In terms of localization, the goal is to design an efficient location determination system to aid with the navigation aspects. The main objective is to achieve an acceptable level of accuracy in terms of location estimation. The last component and arguably the most important one is fire detection. The main goal here is to develop a fire detection system that is accurate, minimizes false alarms, and works in unison with an existing centralized fire alarm system. The objectives are to have zero missed detection calls for most common fire scenarios, to be functional in a smoke-filled environment, a system that can minimize false alarms to below 25%, and to keep the cost under $5000 for the detection system itself. 1.3.2
Constraints
For communication and localization, the main constraint is to have the robot always be within range of at least 4 Wi-Fi Access points so it can pick up at least 4 Wi-Fi signals. One major constraint for fire detection is the detection consists of class “A” fires and small electrical fires such as paper, wood and organic material. A second constraint is for detection in common locations such as desk fires garbage bins, dry storage areas and control rooms. The last constraint is that false alarms be limited to certain test cases consisting of cigarette smoking, cooking, welding, and high temperature operations (ie. engine room). 1.3.3
Criteria
There are four main criteria for navigation, with the first one being to keep the implementation complexity at a minimum to allow for better performance and faster computational speed. The second criterion is to have smooth obstacle avoidance, that is to say the robots will smoothly maneuver around an obstacle without stopping and turning and making jerky movements. The last criterion is to have path optimality, so that the robot will take the best path; this could mean the shortest path in some circumstances. There are two main criteria for localization. The first is for the initial training phase technique, which requires minimal manual overhead and minimal processing to give higher priority to the fire detection process; complexity will need to be held at a minimal level for this to be achieved. In terms of location determination algorithms, a desired accuracy of within +/- 1.0 m of location is required as well as minimal computational processing. The criteria for fire detection includes keeping the cost to under $5000 per unit, to decrease false alarm rate to 25%, to have ease of integration with respect to power source, signal conditioning, and programming. The proposed solution should try to minimize the amount of work required in conditioning the signal output from the sensors of each package; some sensors can be integrated and operated more easily than others. Finally the robot should be able to operate in close proximity to a fire and in smoke-filled environments so that the sensors can still maintain their normal functionalities. 1.4
Patents
1.4.1
Patent #1 - Fire detection
and extinguishment system
1.4.2
Patent #2 - Fire detection
system with IR and UV ratio detector
1.4.3
Patent #3 - System and
method for WLAN signal strength determination
1.4.4
Patent #4 - Location of
wireless nodes using signal strength weighting metric
2
Proposed Solution
2.1
Localization
2.1.1
Initial Training Phase
2.1.1.1
Manual Placement
2.1.1.2
Gaussian Process Regression
2.1.2
Location Determination
Phase
2.1.2.1
Euclidian Distance Location
Determination Algorithm
Where El = Euclidian
distance,
Therefore, this approach scans the entire database, and compares current sensor readings to the sensor readings in the database, for all position values. Clearly the position values with the smallest Euclidean distance will be the output of this algorithm. [5]. This approach has been able to achieve an accuracy of within 2 m, with 4 Wi-fi Access Points. [5] This means that the position value given by this approach is actually off by +/- 2m from the actual position. 2.1.2.2
Monte Carlo Location
Determination Algorithm
Evaluation of Initial Training Phase Technique
Table 1 – Evaluation of Initial Training Phase Techniques Clearly, from the above analysis, “Manual Placement” Technique will be chosen.
Evaluation of Location Determination Algorithm
Table 2 – Evaluation Location Determination Algorithms 2.2
Navigation
Navigation can be subcategorized into Global and Local Path Planning. Global path planning involves finding the most optimal path (in a known environment) from one point to another. Local path planning involves performing fast, real-time obstacle avoidance. There are several methods which are neither global nor local path planners such as the potential field method. However, such methods are not guaranteed to be optimal and may fail if the environment contains local minima (i.e. specific arrangements of obstacles which may cause the robot to become permanently immobilized). Therefore, such methodologies will be excluded from this design in order to maintain navigation continuity. Local path planners by themselves may also suffer from this problem and do not perform well when the goal is far away; however, implementations which consist of both local and global planners are often optimal and guarantee continuity. As such, this design will include a hybrid navigation methodology which will consist of one technique from each category of path planning. [8] 2.2.1
Global Path Planning
2.2.1.1
User-defined
2.2.1.2
Waterfront
2.2.1.3
A* Search Algorithm
2.2.1.4
Assessment
Table 3 – Comparison of global path planning design alternatives As such, the wavefront algorithm will be incorporated into this project and discussed in more detail in the following sections.
2.2.2
Local Path Planning
2.2.2.1
Vector Field Histogram
2.2.2.2
Edge Detection
2.2.2.3
Dynamic Window
2.2.2.4
Assessment
Table 4 – Comparison of local path planning design alternatives As such, the VFH algorithm will be incorporated into this project and discussed in more detail in the following sections.
2.3
Fire Detection System
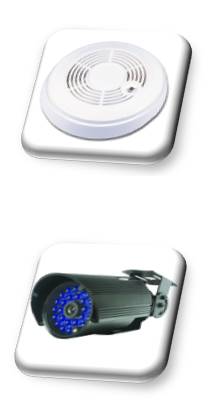
As described in the problem formulation section, the fire detection system must be designed such that it uses advanced fire detection technology to reduce false alarms. The problem with choosing a single sensor for fire detection is that there is no single sensor that is capable of detecting all types of fire and smoke well and consistently. Conventional point smoke and fire detectors such as ionization and photoelectric detectors signal alarms because of a single circuit being closed through the chemical and optical interference of smoke particles. It is common for these detectors to throw false alarms from everyday activities such as cooking, smoking, and even due to the fumes of some cleaning solvents. Therefore they perform differently from one environment to another due to the addition of potential agitators. Furthermore, these devices are distance limited and for larger open areas are rendered ineffective [3]. Several competing technologies were researched and it was found that the higher-end fire detection systems used a combination of ultra-violet and infrared sensors and filters to identify fires. On the basis that flames generate an immense amount of radiation at specific frequencies in the ultra-violet and infrared region, the sensors are used to identify when many of the target frequencies are being given off to signal a fire alarm. These systems often claim significantly reduced false alarm rates due to their inherent redundancy of using multiple sensors to generate a “smart” alarm. Specialized electronics in these systems further process sensor readings for flicker frequency, red vs. blue comparisons, and energy per unit time comparisons to further improve the detection algorithm. The flicker frequency is defined as the rate at which a flame is known to oscillate in perceivable visibility, and is approximated as 10 Hz from experiment [3]. One major weakness of these types of sensors is their sensitivity to heat, and the proximity of heat sources such as furnaces and engines can trigger false alarms. NetSafety’s Triple IR sensor uses three infrared sensors to detect three particular frequencies which correlate to the most common gases in normal-combustible fires. This device also incorporates many additional features to significantly reduce false alarms such as advanced signal processing, flicker frequency analysis, and automatic digital zoom. This system costs $3500 and is the most expensive stand-alone fire detection unit studied for this project. Omniguard produces a similar unit called the Omnigaurd 760 which analyses five spectral bands in the infrared region and claims similar performance specifications. This system has a cost of $2380 but does not use as many digital electronics for added filtering. Ultraviolet radiation detection techniques have been discontinued from mainstream fire-detection practice as they are highly sensitive to bright light from natural sources (i.e. sunlight) and industrial practices such as welding. However, they can be used to detect the presence of erroneous readings if used in conjunction with a suite of fire detection sensors. For this purpose a minimal cost ultraviolet sensor was researched. One bare ultraviolet sensing package is the Hamamatsu UVTron Sensor which retails for approximately $80 CAD. It has a peak spectral response for a narrow band of ultraviolet radiation (185nm-260nm) and is insensitive to visible light. There are also several commercial vision systems designed for fire and smoke detection. They use wavelet domain analysis techniques to identify flames and smoke in a camera’s field of view. However, the costs of these systems are highly restrictive for the purposes of this project as they go well above $10,000. A lower cost alternative is to use open-source vision software such as OpenCV and an off-the-shelf video camera. Several resources are available to assist in the development of fire detection algorithms through vision and can be leveraged for due implementation in this project. 2.3.1
Assessment
Table 5 – Sensor Package Alternatives
Table 6 – Sensor Package Decision Matrix Based on the valuation carried out in the form of a decision matrix (Table 6), Package 1 seems to be the best option for this design. The performance of the higher end triple IR sensor, in fact, did justify the cost for the design criteria defined by the problem formulation. 3
Design
3.1
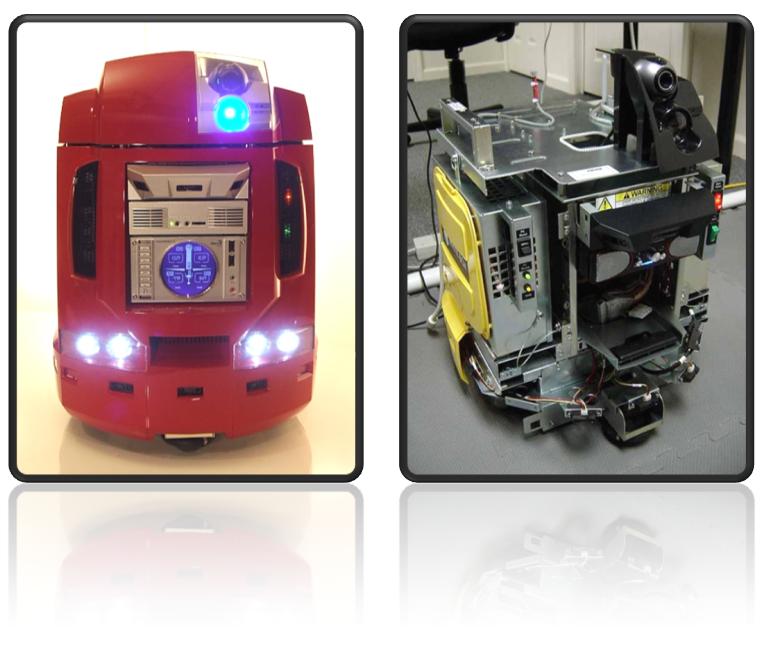
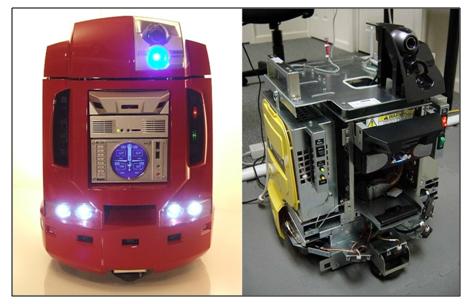
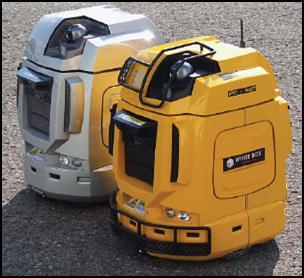
914 PC-BOT
The 914 PC-BOT (shown in Figure 1) from Whitebox Robotics (hereinafter referred to as pcbot) has been predominantly designed to serve as a development platform for a variety of applications such R&D, academic research and proof-of-concept projects and offers a great deal of design versatility. The robot consists of very standard PC hardware which can be very easily accessed, programmed, configured and modified. It offers numerous enabling technologies such as 802.11g wireless communication (see Appendix A for detailed specifications). Many operating systems such as Windows, UNIX and several flavors of Linux (including Ubuntu) can be deployed on the pcbot. In order to utilize several open source robotics and sensor interfacing projects such as Player/Stage, Ubuntu Linux was chosen as the main platform for this project. [7]
Figure 1 – Whitebox Robotics 914 PC-BOT with and without body cover [7] 3.2
Player/Stage Project
Based on the widespread usage of Player/Stage in the field of robotics, the potentially enormous benefits of the above capabilities, the lack of any other viable competitors and the fact that it is free, it was chosen as the underlying platform to be used for this project. 3.3
Localization
3.3.1
Design of Manual Placement
Algorithm
Program Record_Data { Record_Position(); for each (Wi-fi Access Point in Range) { Record_AP_signal_strength(100) } For each (LASER Sensor) { Record_LASER_Sensor_Value(100) } }
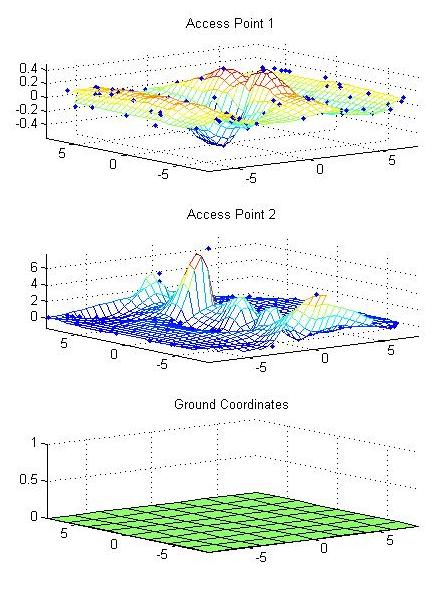
The Record_Position() function will use ask the user to input the current position. This is possible because each of the robots can be connected to a monitor and a keyboard and be used as a computer. Thus data can easily be written into the robot. The Record_AP_signal_strength function will use Linux’s “wireless-tools” services. Specifically “iwconfig” service will be used to obtain signal strengths. The Record_LASER_Seonsor_value function will use ‘player-stage’ project’s sensor data acquisition service, for the LASER seonsor. In a graphical manner, the different mappings and translations can be put together as in Figure 2 below. Note that the following graphs are based on fictional data for illustration purposes.
Figure 2 - Mapping between different layers In the figure above, the most bottom layer is that of ground coordinates. A grid can be seen which where the values will be recorded. Above that layer, there is Wi-fi Access Point # 1 layer, which contains the signal strength data from Wi-fi Access Point #1. Similarly there is a layer for Wi-fi Access Point #2. The above layers represented in data form will be the final product of the Initial Training Phase. Finally, the data structure that stores all the data, is designed as follows: structure Mapping_Data { Ground_coordinates[5] AP_Signal_Strengths[4][100] : int AP_SSID[4] : char AP_Channel[4] : int LASER_vals[100] : int
} In the above data structure, Ground_coordinates records the x and the y coordinate of that location. AP_Signal_Strength, will hold the 100 samples for the 4 Wi-fi Access Points. AP_SSID will hold the SSID names for those Wi-fi Access Points. AP_Channel will hold the channel on which the signal strength was recorded for each Wi-fi Access Point. Finally, LASER_vals will hold the 100 samples recorded from the LASER sensor. Finally there will be a 2-dimensional array of Mapping_Data structures to cover the entire area. structure Map_Base_Data { Mapping_Data[MAX_X_COORDINATES][MAX_Y_COORDINATES] } This will hold the entire information, which will be used by Monte Carlo algorithm to deliver position data. 3.3.2
Design of Interface to
Monte Carlo Location Determination Algorithm
To analyse the design feasibility, the signal strength can be easily recorded from “iwconfig” on Linux Operating System. LASER values can be recorded by interfacing with the LASER sensor through the “player-stage” project. Finally the Monte Carlo Algorithm can also be used from the “player-stage” project. As a Design Review, as discussed earlier, the design will meet the objective of an accuracy within 1.0m, with minimal processing required when the robots are also detecting fires, i.e. in ‘online’ mode. This is because “Manual Placement” data recordings will be done in ‘offline’ mode before the robots start detecting fires, and only the Location Determination will be carried out in ‘online’ mode. To summarize the design, Manual Placement technique will be used to record data, and Monte Carlo Algorithm to determine location. The expected performance would be an accuracy of within 0.5m, and the processing will only be required by the “Monte Carlo” algorithm, when the robots need to know position information. 3.4
Navigation
3.4.1
Global Path Planning –
Wavefront
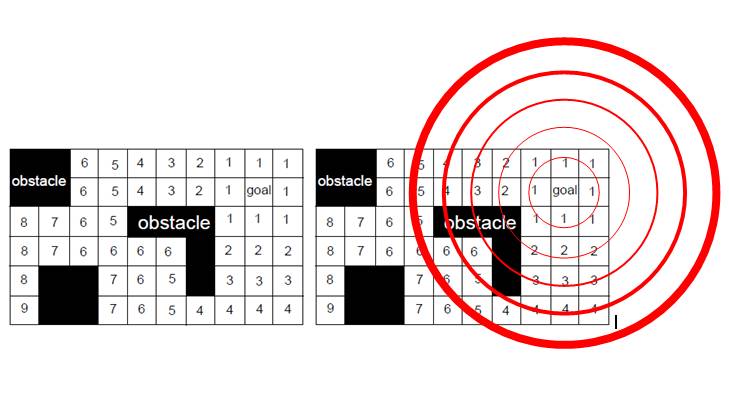
Figure 3 – Wavefront grid assignments and linearly strengthening virtual force fields [9]
3.4.2
Local Path Planning – VFH
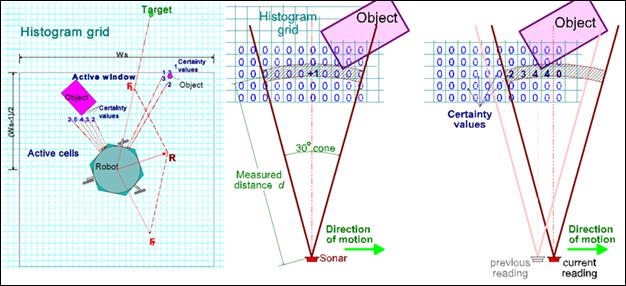
Figure 4 – Vector Force Field (VFF) algorithm performing a data sweep in real-time [11] Cells which do not associate with an obstacle or the target have a force of zero. The sum of the forces R (Ftarget - Frepulsive) causes a change in the direction and speed of the robot in order to smoothly move around obstacles and towards the target. Although VFF was revolutionary at the time of its proposal, it suffered from several problems including operation in narrow hallways (as shown in Figure 5). The forces applied by either side of the hall would cause an unstable oscillatory motion which resulted in collision. The algorithm behaved undesirably in other situations such as those where two obstacles were very together and directly in front of goal. [11]
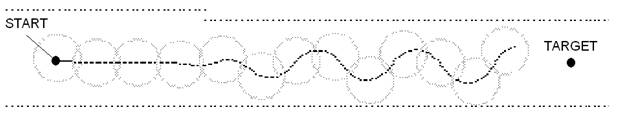
Figure 5 – Unstable oscillatory motion of the robot using VFF in a narrow hallway [11] The shortcomings of the VFF algorithm lead to its optimization as the VFH algorithm. This optimization involved the addition of a one-dimensional polar histogram to the existing two-dimensional Cartesian histogram grid (as shown in Figure 6).
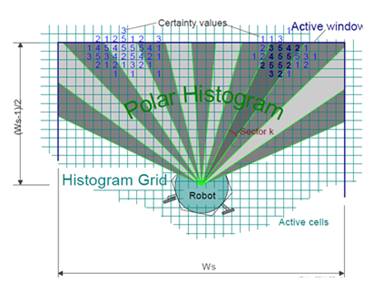
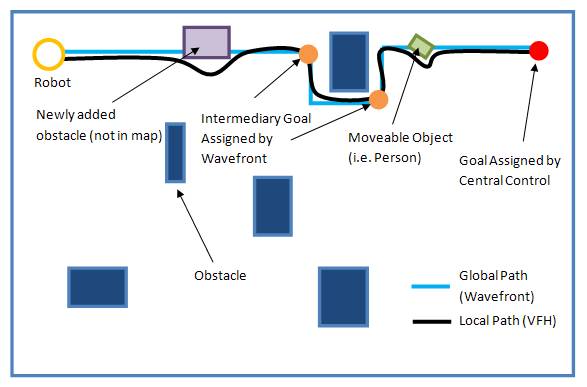
Figure 6 – VFH algorithm utilizing a one-dimensional polar histogram [11] This polar histogram creates a probability distribution for each sector (of angular width α) based on the density of obstacles and several other factors. This normalization fixes the majority of the problems observed in the VFF algorithm. Vector forces are no longer applied in a single line of action; instead, numerous blobs of varying strengths push/pull the robot towards a general direction. Additionally, a reduction in the amount of data leads to an increase in efficiency in comparison to the VFF algorithm. [11] Although the wavefront and VFH algorithms each have the capability to reach the goal from the start position individually, this will not necessarily guarantee path optimality. VFH guarantees local but not global path optimality while wavefront does not perform real-time obstacle avoidance. This design will involve the implementation of a wrapper program in the central control system which will systematically assign goal positions to the wavefront driver in order to cover the given area in its entirety. The wavefront driver finds the optimal path from the robot’s current position to the given goal. It then forward smaller goal positions along the optimal path to the VFH driver in a sequential manner. VFH will in turn perform real-time obstacle avoidance and drive the robot to goal positions supplied by wavefront (as shown in Figure 7).
Figure 7 – Example of the proposed system in action
3.5
Fire Detection System
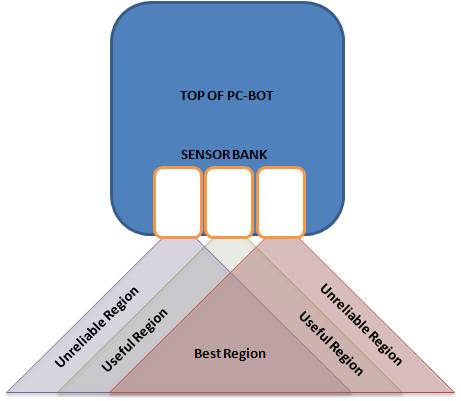
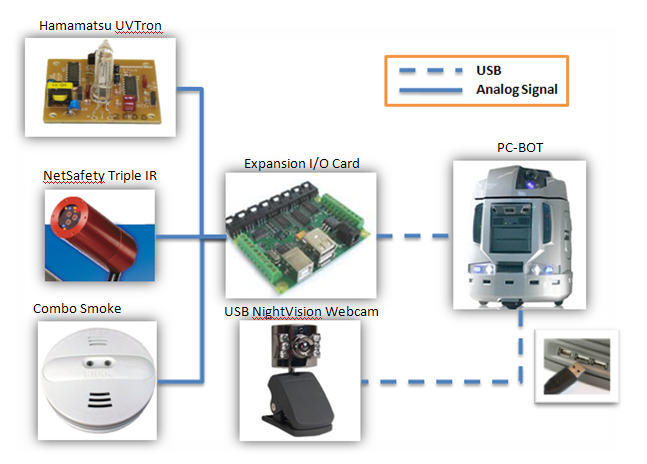
Figure 8 – Alignment issue with sensor field of view Since the sensors cannot distinguish which region the measurement was taken, with the exception of the night vision web camera, the robot will have to stop and pivot in one location in order to verify that any readings in the unreliable region can be confirmed to a certain degree by the remaining sensors. This will reduce the efficiency of the fire search method but is only likely to occur when there is either a large presence of false alarm stimuli in the same area or a fire. An alternative is to stack the sensors vertically, however, there arises a need for a complex housing to be custom built to prevent damage to the sensor components when mounting the sensors on top of one another. Furthermore, this only shifts the same problem to the vertical scale, as the vertical field of view would no longer line up. For this reason, the sensors are to be mounted adjacently and the robot is designed to pivot in the presence of only a single positive fire signal. The integration procedure of these sensors into the overall robot system is illustrated in the following figure. The analog outputs of the UVTron and NetSafety Triple IR are directly connected to the expansion I/O card of the PC-BOT in order to convert the signals to computer readable digital signals. The smoke alarm is also connected to the I/O card after reconfiguring the alarm circuit to send the alarm signal to the I/O card rather than the speaker. The webcam is directly connected to the PC-BOT through a USB 2.0 connection.
Figure 9 – Fire Detection Sensor Integration with Robot System
All of these sensors, with the exclusion of the webcam, require basic high level drivers to be built using Player API. Through these drivers the sensor measurements can be read by the program running on the Player environment which is controlling each robot. Along with drivers, an entire vision system needs to be written using open source OpenCV vision libraries to provide added redundancy in fire and smoke detection readings. Several methods exist for the detection of fire through live video capture. A few of these methods are explained in [3], where emphasis is placed on the wavelet domain analysis of moving object contours being the most effective technique of identifying fires with a minimum number of false alarms. Wavelets are high-pass filtered measurements of pixel colours. In the wavelet domain, a high-pass filter of 10Hz enables random agents such as fire to pass through due to its inherent flicker frequency. However, it is also known that this frequency is not constant for all fires, but rather changes for different fuel sources and environment conditions. This frequency is not even consistent for a single fire, but rather acts extremely randomly. This is why a Markov model is used to analyze the contours of fire-coloured pixels that have already passed through the filtered wavelet domain. The random flickering of the contours of fire are to be used to identify the fires through video.
Figure 10 – Fire-coloured object is identified using wavelet domain analysis of moving contours [3] Based on the design objectives and constraints, the overall fire detection system does indeed meet all of the requirements. In terms of accuracy and the minimization of false alarms, four sensors are being used to build redundancy checks to ensure that only fires set of alarms. Furthermore the inclusion of high-end infrared detection technology and the latest vision algorithms makes this system severely less prone to false alarms. The actual false alarm rate of this system has yet to be determined. Lastly, the cost objective is also met as the sensor system does not cost more than $4000. Since the fires are being constrained to class A fires, the infrared sensor alone is more than capable of detecting these types of fires. Furthermore, the use of a vision system for added smoke detection redundancy improves upon the ability of the fire detection system to pick up desk fires and garbage bin fires, as part of the design constraints. Lastly, the addition of an UV sensor allows for the detection of erroneous false alarm stimuli such as welding, sunlight, etc. 4
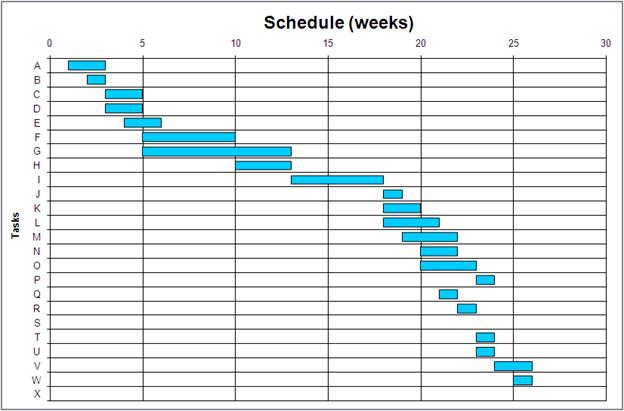
Schedule and Budget
|
||||||||||||||||||||||||||||||||||||||||||||||||||||||||||||||||||||||||||||||||||||||||||||||||||||||||||||||||||||||||||||||||||||||||||||||||||||||||||||||||||||||||||||||||||||||||||||||||||||||||||||||||||||||||||||||||||||||||||||||||||||||||||||||||||||||||||||||||||||||||||||||||||||||||||||||||||||||||||||||||||||||||||||||||||||||||||||||||||||||||||||||||||||||||||||||||||||

|
Task |
Task Description |
Start Time (week) |
End Time (week) |
Duration (weeks) |
Prerequisites |
|
A |
Brainstorming and researching |
1 |
3 |
2 |
- |
|
B |
Preliminary Design Presentation |
2 |
3 |
1 |
A |
|
C |
Fire detection research |
3 |
5 |
2 |
A, B |
|
D |
Sensors assessment and selection |
3 |
5 |
2 |
C |
|
E |
Swarm navigation and WLAN communication research |
4 |
6 |
2 |
B |
|
F |
Design of sensor integration package and navigation algorithm |
5 |
10 |
5 |
D |
|
G |
Sensors acquisition |
5 |
13 |
8 |
F |
|
H |
Final design presentation and report |
10 |
13 |
3 |
E,F |
|
I |
Exam Weeks and holidays |
13 |
18 |
5 |
- |
|
J |
Testing and analysis of PC bots |
18 |
19 |
1 |
- |
|
K |
Calibration of communication protocols |
18 |
20 |
2 |
J |
|
L |
Sensor calibration and integration |
18 |
21 |
3 |
G |
|
M |
Development of obstacle avoidance in navigation |
19 |
22 |
3 |
K |
|
N |
Development of swarm communication |
20 |
22 |
2 |
K |
|
O |
Development of WLAN localization mapping |
20 |
23 |
3 |
K |
|
P |
Testing and debugging |
23 |
24 |
1 |
M,N,O |
|
Q |
Testing of sensor package for fire detection |
21 |
22 |
1 |
L |
|
R |
Recalibration of sensors |
22 |
23 |
1 |
Q |
|
S |
Mounting of sensors on robots |
23 |
23 |
0 |
R |
|
T |
Integration of sensor package with robots |
23 |
24 |
1 |
S,P |
|
U |
Initial test runs of robots |
23 |
24 |
1 |
T |
|
V |
Debugging and optimization |
24 |
26 |
2 |
U |
|
W |
Final test runs |
25 |
26 |
1 |
V |
|
X |
Design symposium |
27 |
27 |
0 |
W |
In terms of commissioning, the only component would be the tasks highlighted
in green, integration of the sensor packages with the robotic system and
initial test runs of the robots. Testing is broken down into several stages.
First the robots will be tested in week 18 to make sure they are all up and
running and meeting the required expectations. The next stage of testing
comes in week 21-24, in testing and debugging of the navigation and
localization systems as well as testing of the sensor packages for detection.
The last component of testing will be done in weeks 24-26, where the robots
will be debugged for final test runs and optimization.
4.1
Budget
The proposed solution consists of a NetSafety Triple IR sensor for flame
detection, a Hamamatsu UVTron sensor to help identify false sources of fires,
a combination photoelectric/ionization smoke detector, and a USB night vision
camera for fire and smoke detection. The costs are as follows:
|
Sensor |
Price ($) |
|
NetSafety Triple IR |
3500 |
|
Hamamatsu UVTron |
80 |
|
Photoelectric/ionization smoke detector |
50 |
|
Night vision camera |
50 |
Table 7 – Overall system cost breakdown
As stated earlier, the objective was to reduce cost down to under $5000 per
detection package. This expected cost will meet the requirements of less than
$5000.
5
Conclusions
A mutli-sensor package has been selected for the implementation of the fire
detection system. This sensor system satisfies all cost and performance
objectives outlined during problem formulation. False alarm rates are yet to
be confirmed through testing however, there is a fair amount of certainty
that the overall system will perform adequately due to the built in
redundancy of sensor package. For Initial Training Phase, Manual Placement
technique will be used. To determine the location, the Monte Carlo Algorithm
will be used. Overall, the localization system will only use processing power
when determining the location, and will time-share the processor with the
fire-detection process. The system will be able to give position with an
accuracy of within 0.5m. A combination of two path planners (one global and
one local) have been used to obtain a highly optimized hybrid methodology
which will provide efficient and rapid navigation of complex environments
while smoothly avoiding obstacles as well as guaranteeing local and global
path optimality. The proposed solution meets and/or exceeds all required
objectives mentioned.
6
Recommendations
1. It is recommended that the cost of the sensor package is miniaturized even further so that it is easier to fund the purchase of three sets of these sensor packages.
2. It is recommended that a custom multi-IR sensor is designed using the basic raw components found in the higher-end devices. The main issue with this is that sourcing infrared sensors that operate in the 1-5µm range is difficult.
3. To increase the accuracy of the Localization system it is recommended that the initial training be performed at intervals of 0.5m. The new data can be used by the Monte Carlo Algorithm and thus the system could give a higher accuracy than 0.5m.
4. It is further recommended that a modular fire suppression system be designed following the successful implementation of this autonomous robot fire detection system.
7
References
[1] Mount, Mike. “U.S. Navy boots captain after fire on carrier,” CNN News,
7/30/2008. <http://www.cnn.com/2008/US/07/30/navy.captain.fired/index.html>
[2] S. Woodruff, T. Conway, C. Edwards, and J. Elder. “The United States navy
attracts young women who smoke,” Tob Control. 1999 June; 8(2): 222–223.
[3] Toreyin, B.U.; Cetin, A.E., "Online Detection of Fire in
Video," Computer Vision and Pattern Recognition, 2007. CVPR '07.
IEEE Conference on , vol., no., pp.1-5, 17-22 June 2007.
[4] F. Duvallet and A. D. Tews, “WiFi Position Estimation in Industrial
Environments Using Gaussian Processes,” 2008 IEEE/RSJ International
Conference on Intelligent Robots and Systems, pp. 2216–2221, September 2008.
Accessed: Nov. 16, 2008.
[5] S. Chantanetral, M. Sangworasilp, and P. Phasukkit, “WLAN Location
Determination Systems,”Faculty of Engineering, Computer Research and Service
Center (CRSC), King Mongkut's Institute of Technology Ladkrabang (KMITL),
Bangkok, Thailand Accessed: Nov. 16, 2008.
[6] A. Howard, S. Siddiqi and G. S. Sukhatme, “Localization using WiFi
Signal Strength,” http://robotics.usc.edu/~ahoward/projects_wifi.php,
Accessed: Nov. 16, 2008.
[7] “914 PC-BOT Robotics Development Platform – Linux Version”,
Whitebox Robotics, Inc, pp. 2, 2008.
[8] B. Gerkey, “Path Planning vs. Obstacle Avoidance,” Stamford University,
CS225B Lecture Slides, Oct. 2006.
[9] L. C. Wang, L. S. Yong, M. H. Ang, “Hybrid of Global Path Planning and
Local Navigation implemented on a Mobile Robot in Indoor Environment,” Gintic
Institute of Manufacturing Technology, National University of Singapore, pp.
1-3, Singapore, 2001.
[10] D. Fox, W. Burgard, S. Thrun, “The Dynamic Window Approach to Collision
Avoidance,” University of Bonn, pp. 2-6, Germany, 1996.
[11] J. Borenstein, Y. Koren, “The Vector Field Histogram - Fast Obstacle
Avoidance for Mobile Robots,” IEEE Journal of Robotics and Automation,
Vol 7, No 3, pp. 278-288, June 1991.
Appendix A – PCBOT Physical Specifications
The following specifications have been provided by Whitebox Robotics, Inc. [1]
·  Height:
53.4 cm Weight: 25 kg
Height:
53.4 cm Weight: 25 kg
· Payload: Up to 5 kg
· Maximum Climb Slope: 8 degrees
· Differential drive train with independent front suspension, patented self-cleaning roller ball casters and 2 DC stepper motors
· Torso unit containing: 2 foldable side bays (power supply housing/ bay 1, main system board/ bay 2), 8 x 5.25" bays (5 available to user, 1 used for sensors, 1 used for 5.25” speaker and 1 used for Slim DVD/CD-ROM and SATA HDD).
· USB Machine Management Module (M3) - motor controller and I/O board interface
· One I/O board with 8 analog inputs for IR or other sensors, 8 digital outputs, 8 digital inputs and 2 USB ports sourced from the Mini-ITX.
· Two M2-ATX power supplies with automatic battery monitoring and auto-shutoff
· Head assembly containing one web camera