photo gallery
Welcome! This area will be updated as we go,
showing images of our project as it comes together. Posts
go from newest to oldest.the test rig
This is our one-axis test rig. It's controlled by an arduino, and allows us to consistently lay down welds to pre-programmed specifications. A controlled and consistent weld is very important for tuning our control algorithm.
The valve assembly
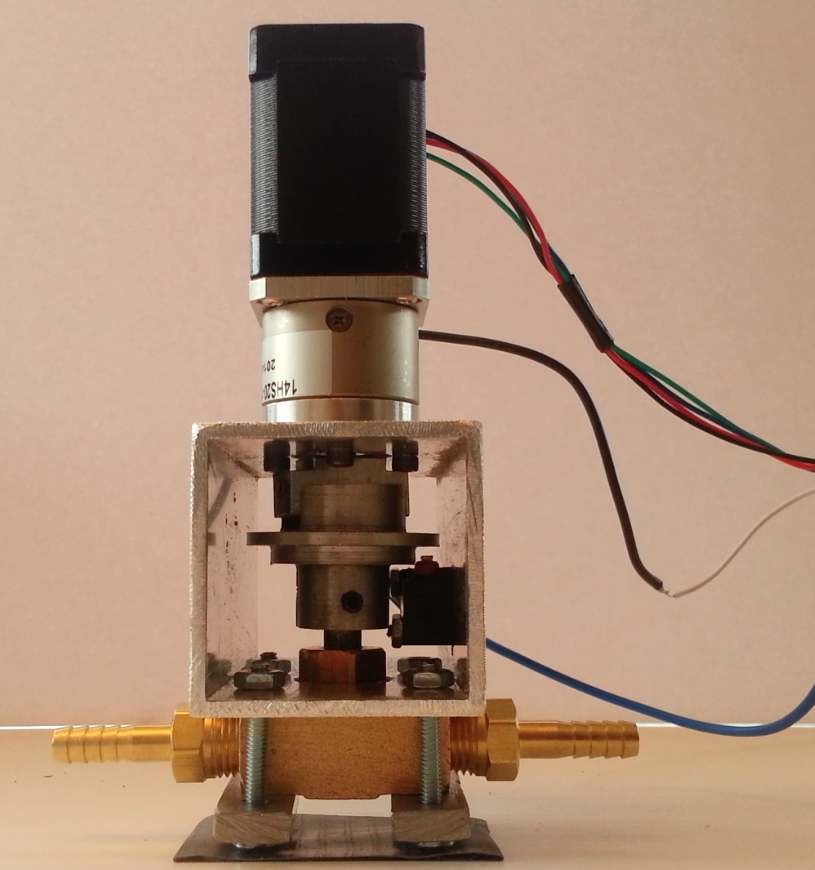
This is the valve assembly. This goes in between the gas tank and the welder. Our control board and motor controller tell the stepper motor how much it needs to adjust the gas flow.
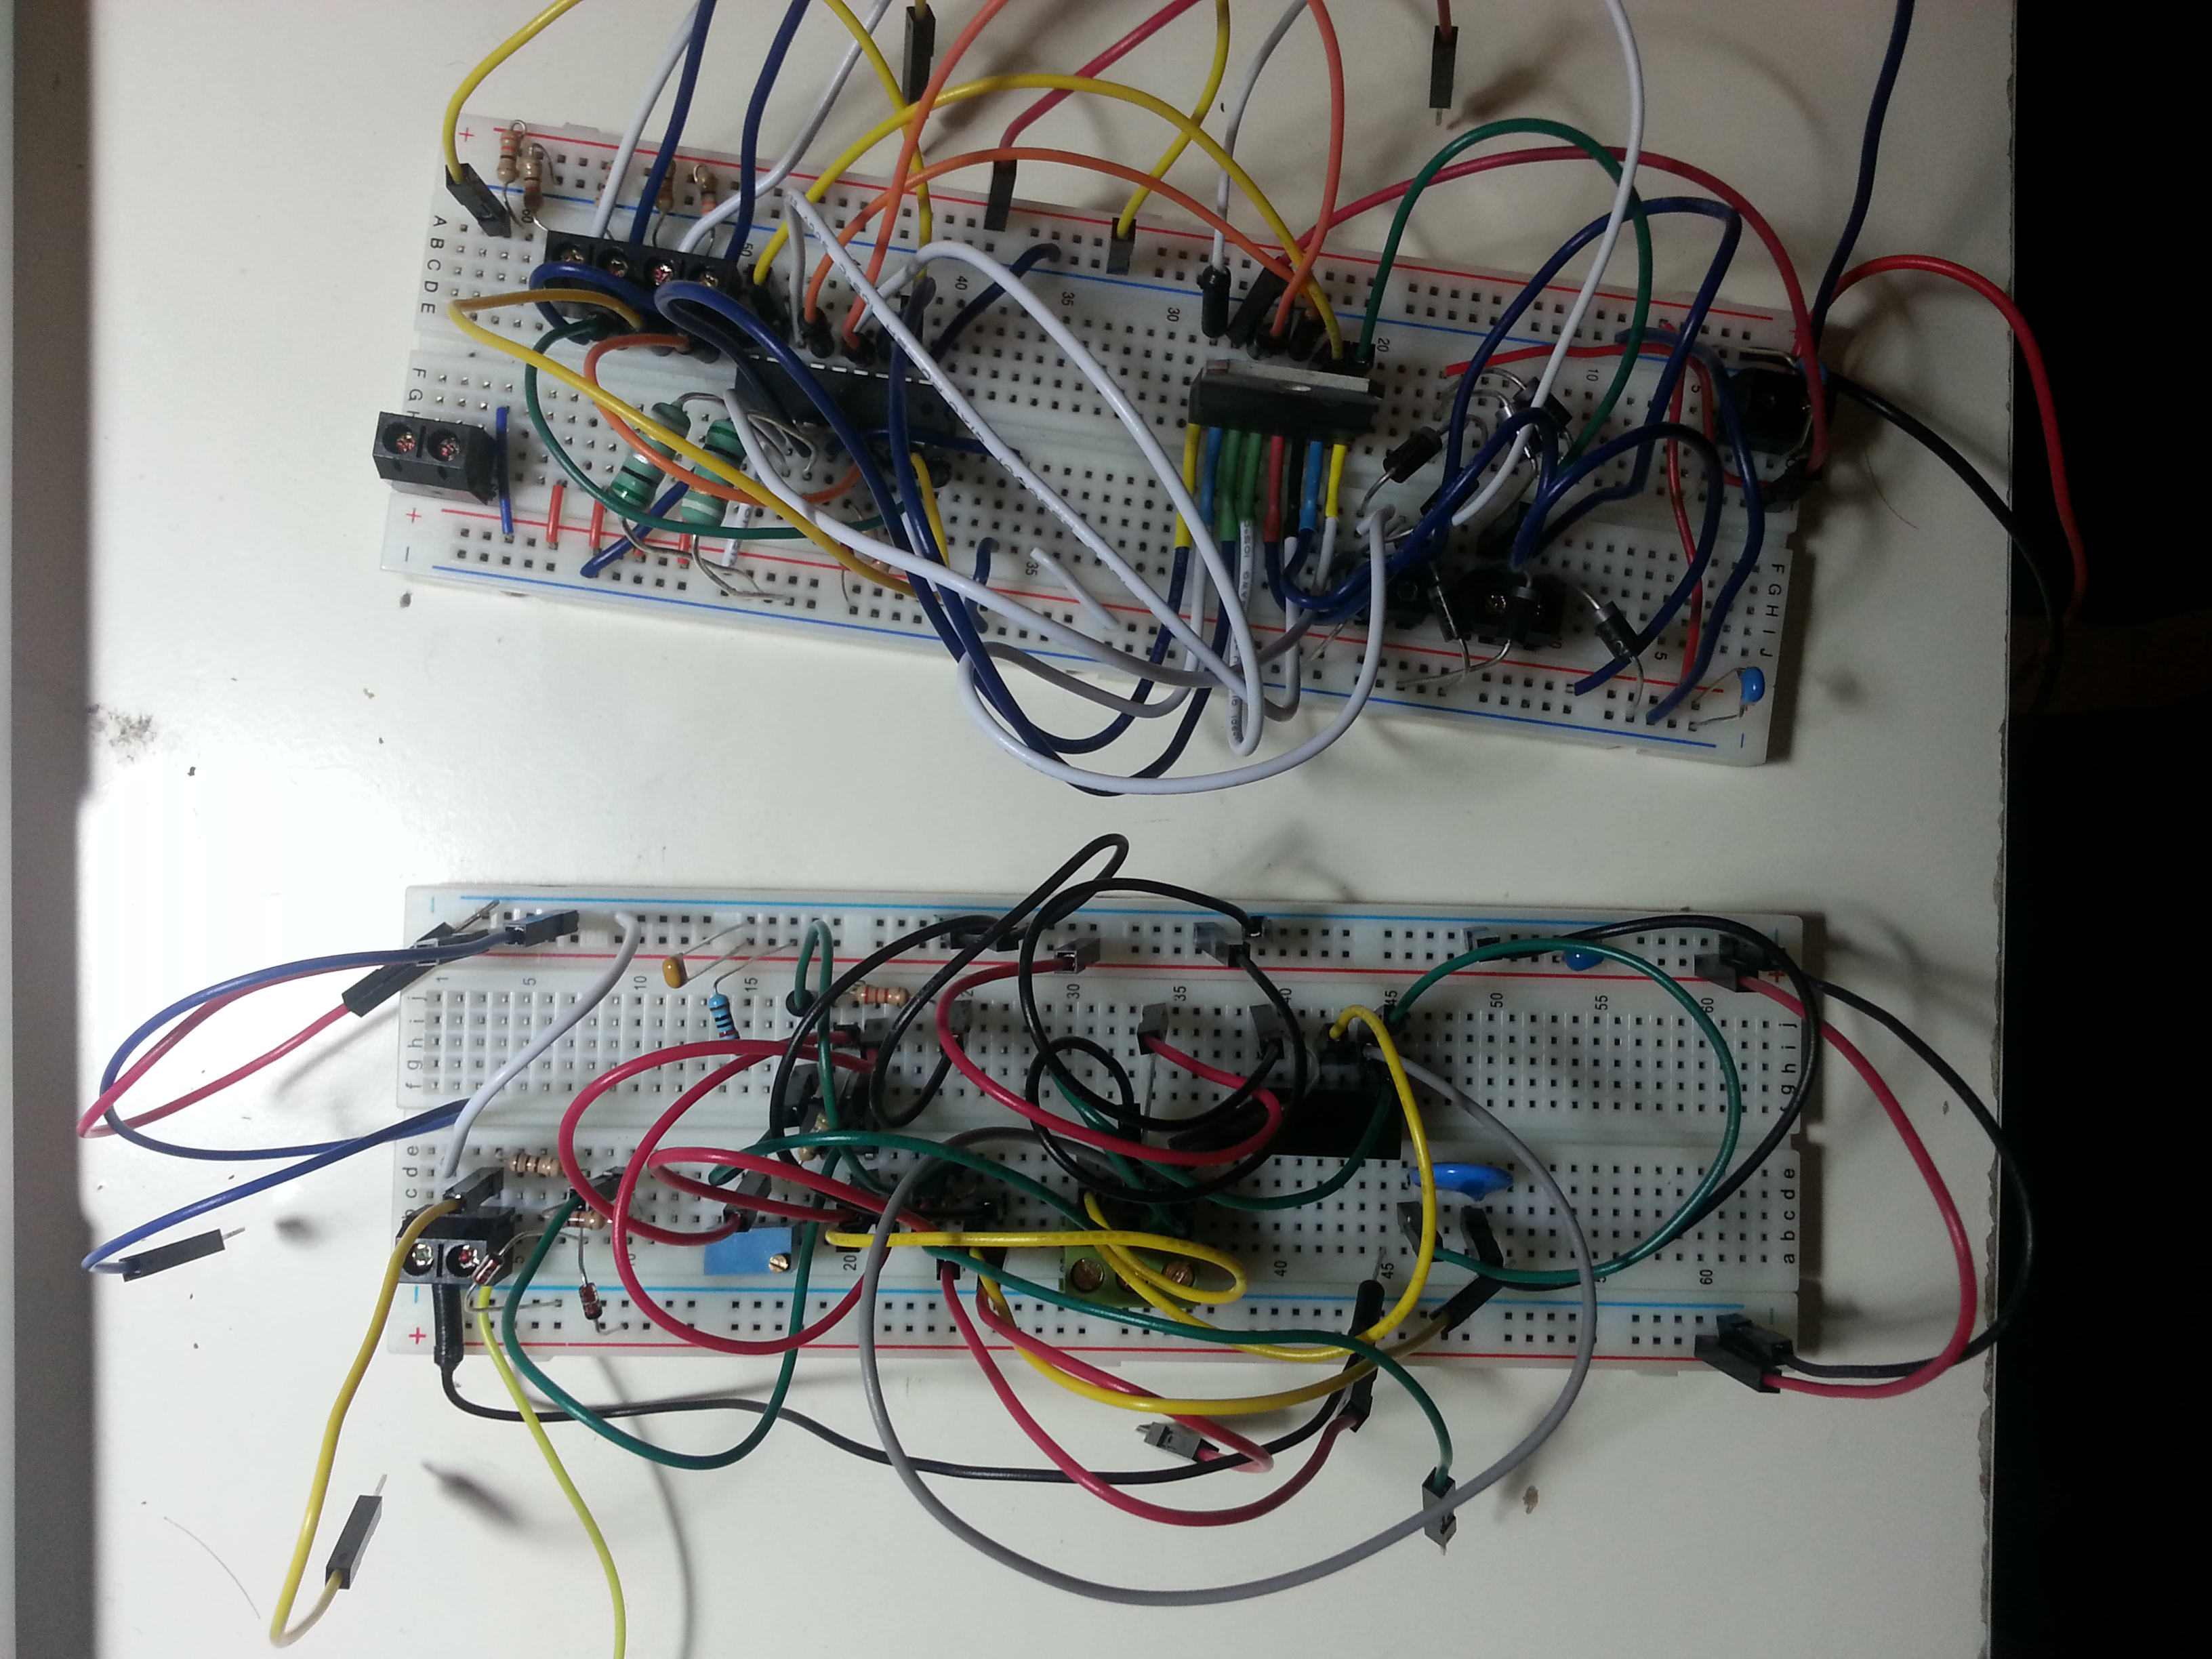
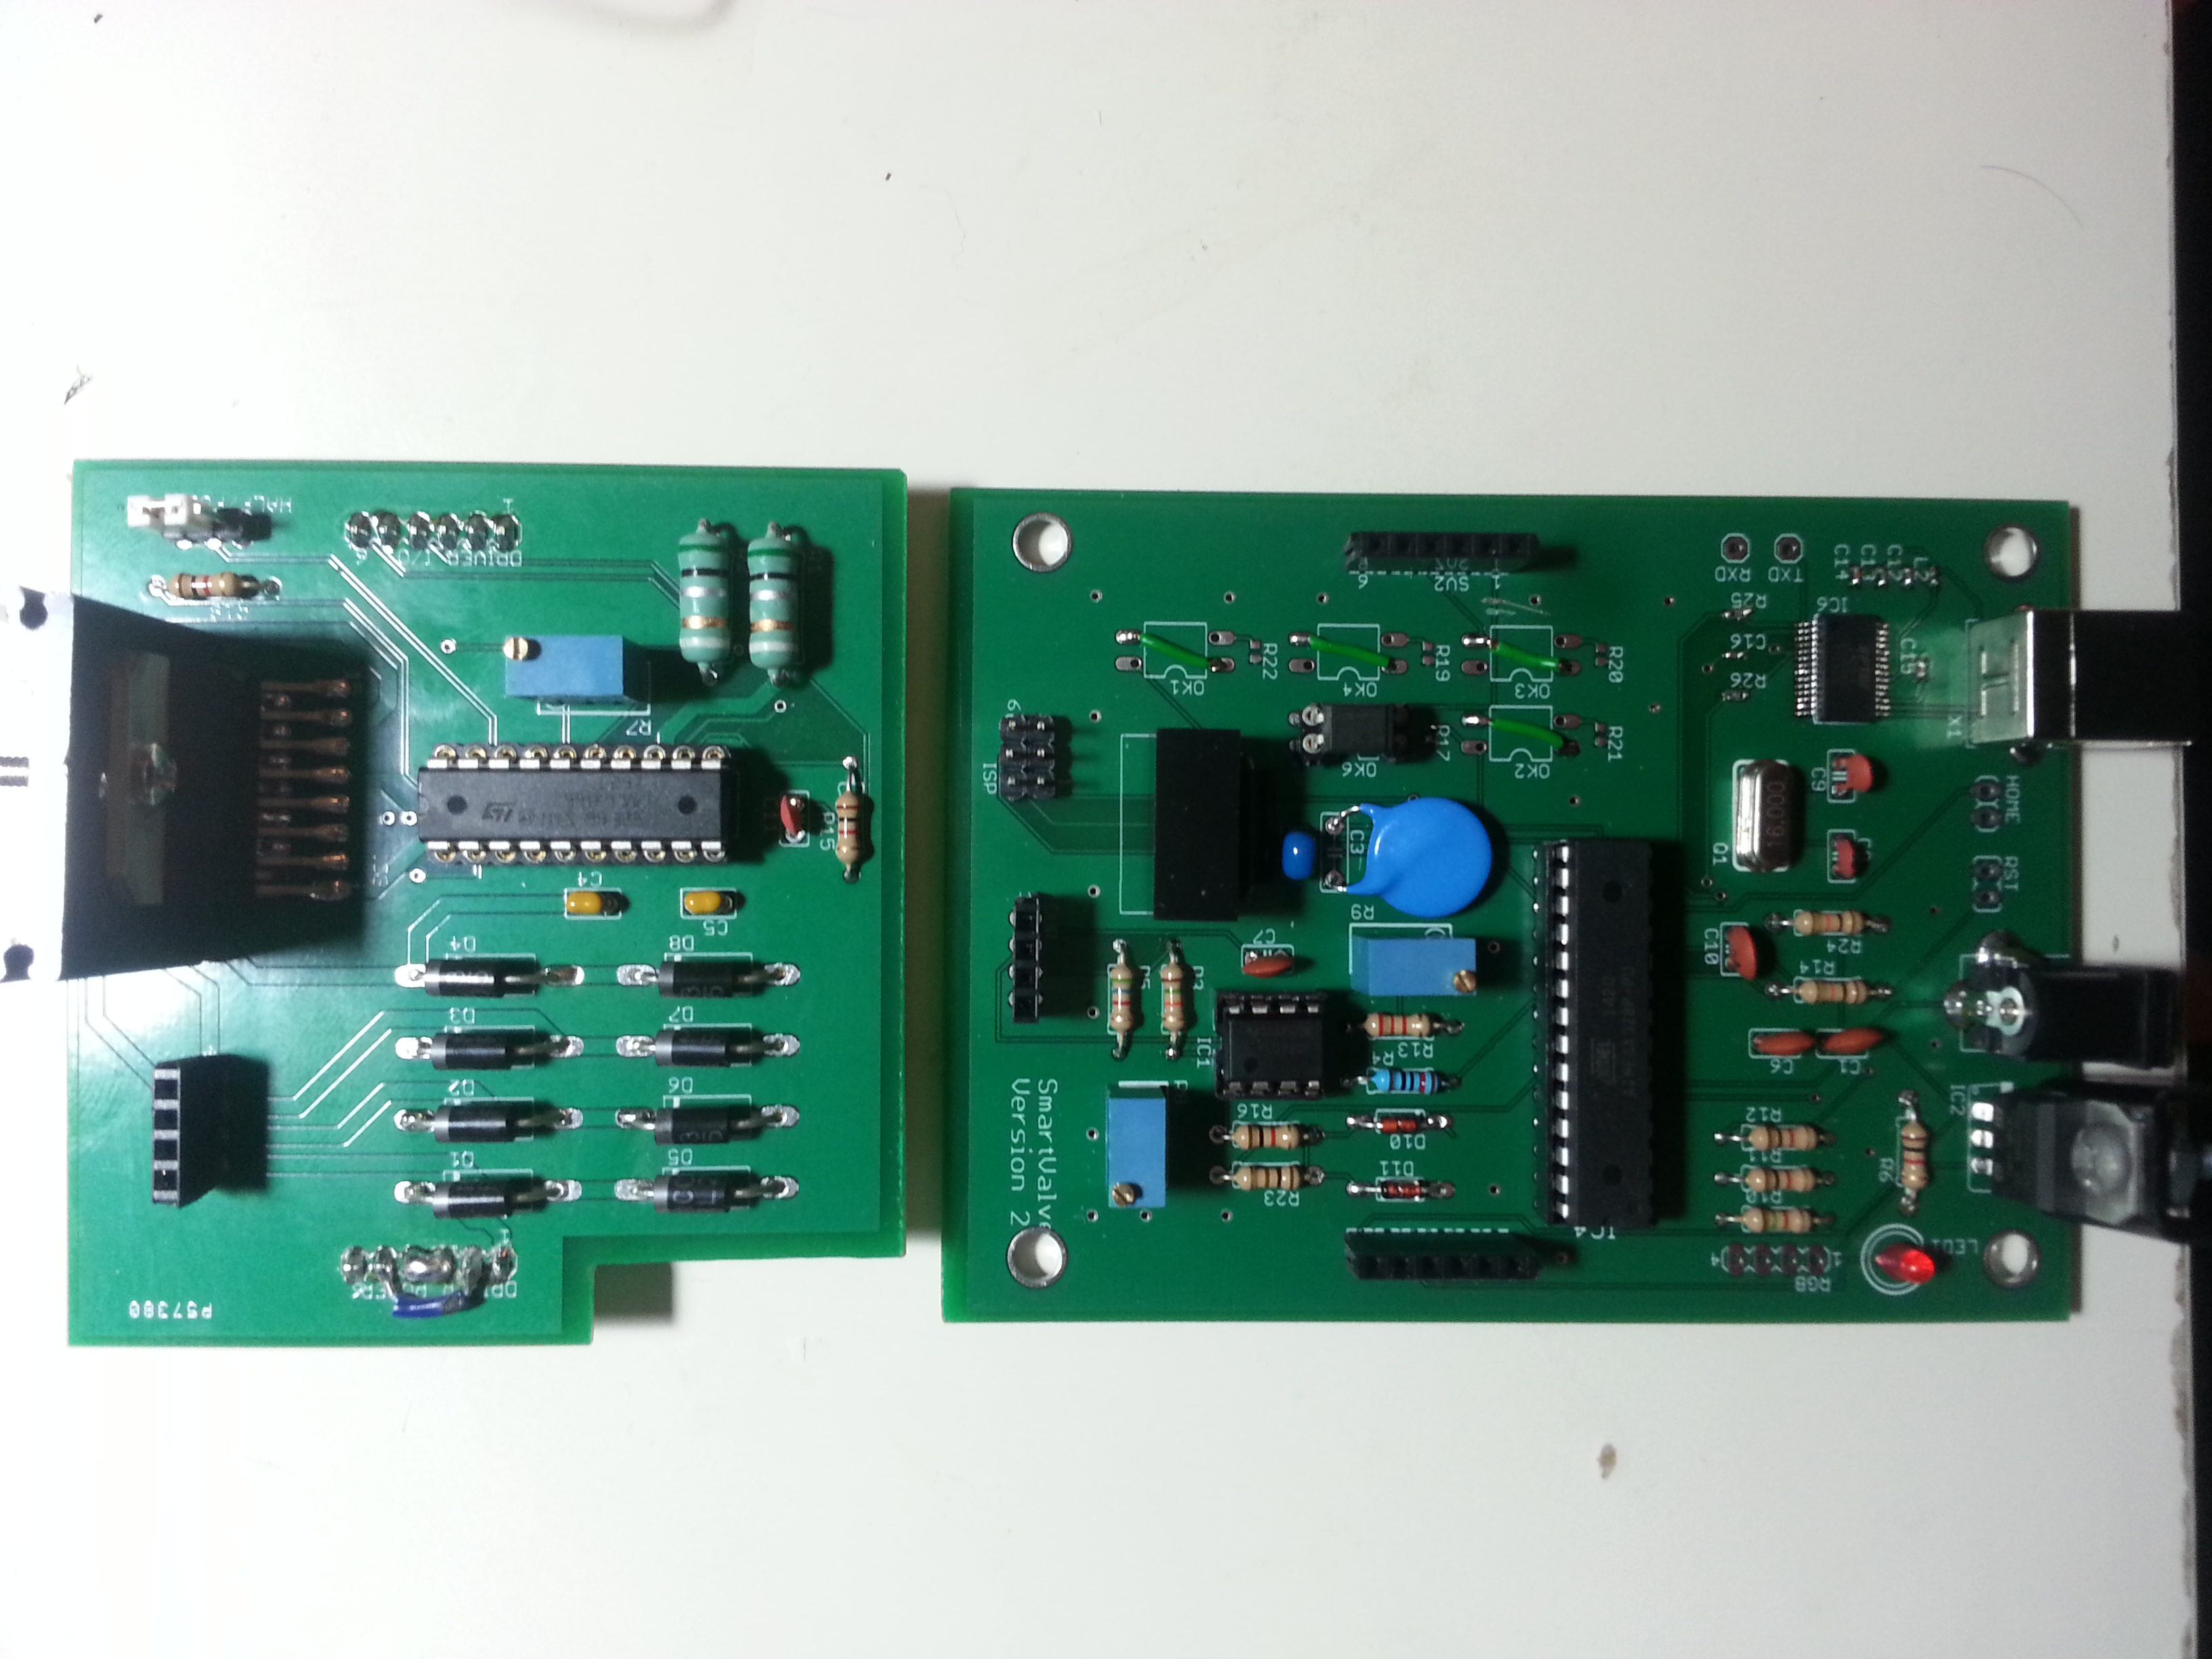
The electronics
The results
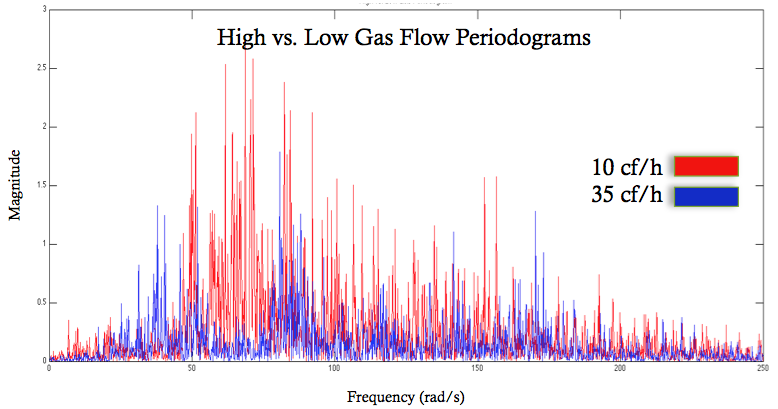
This is an overlayed frequency analysis of the electrical current. Note that at 10 cf/h, there is a much higher magnitude of frequencies in the 50-100 rad/s region. This is the range of frequencies which we will be paying close attention to, as they reveal the oxidation as it happens.
The experiments
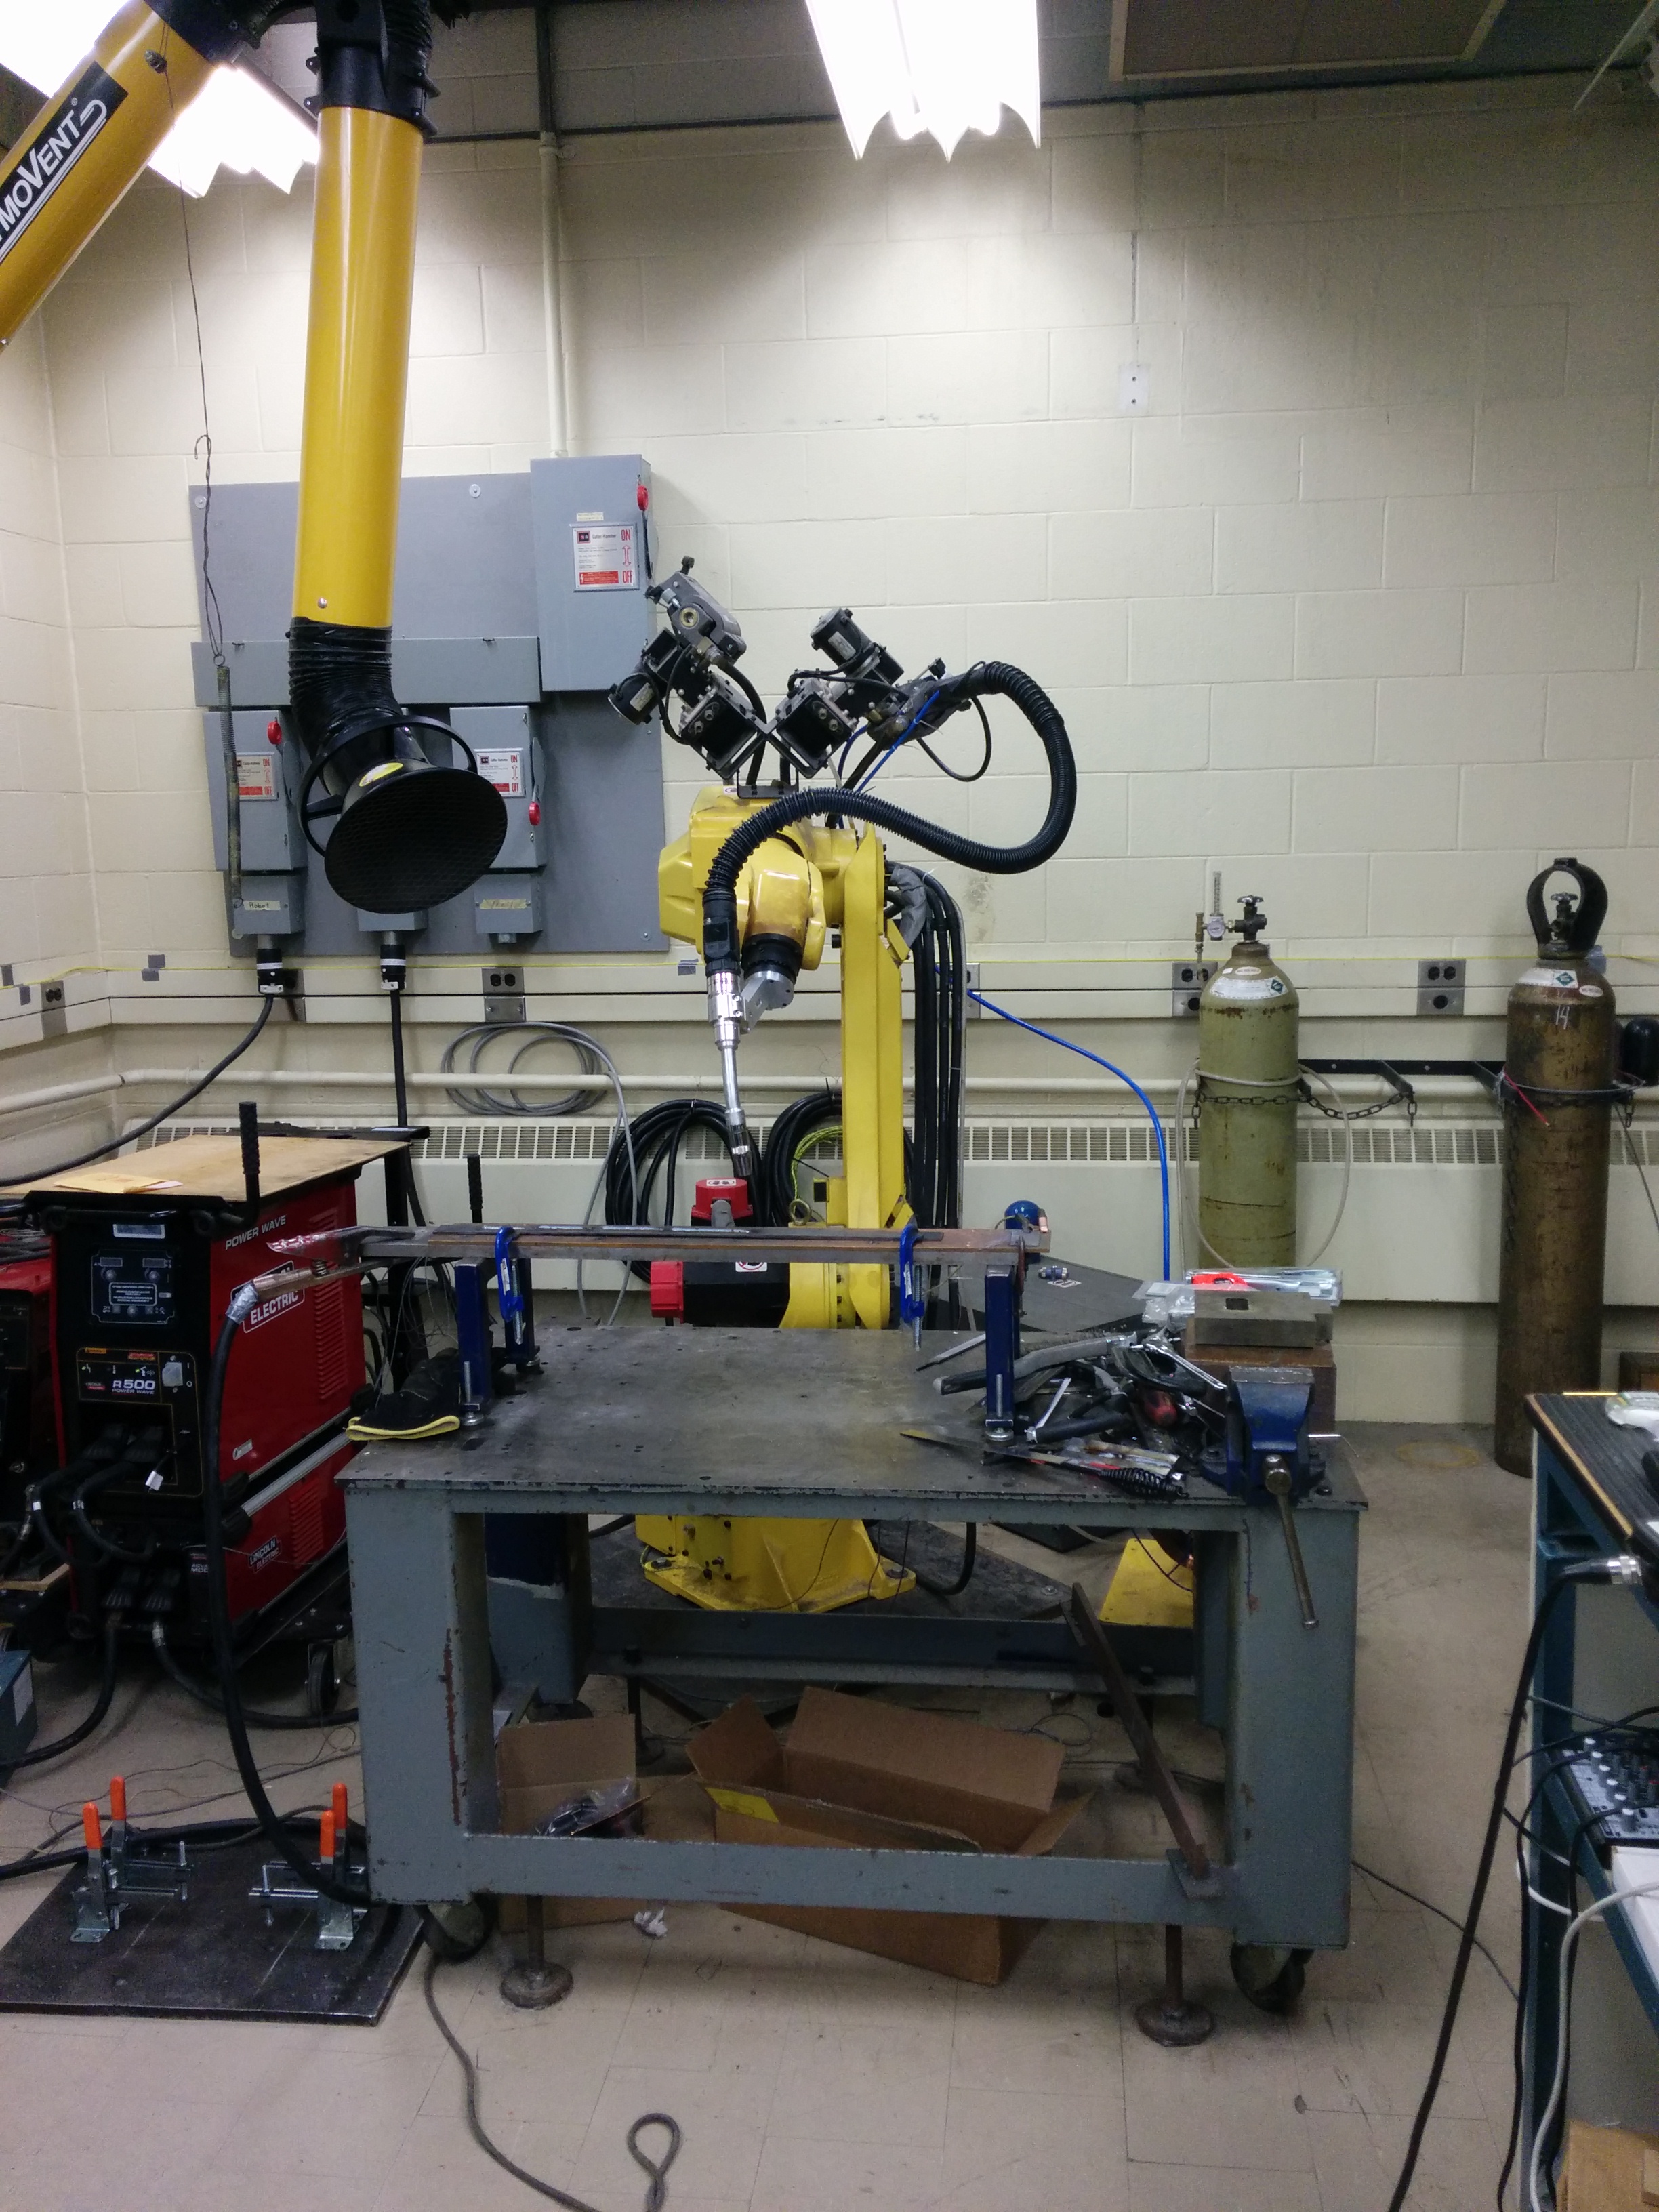
These photos were taken in a weld lab here at UW. What you're seeing is a six-axis welding robot, which we used to gather our experimental data.
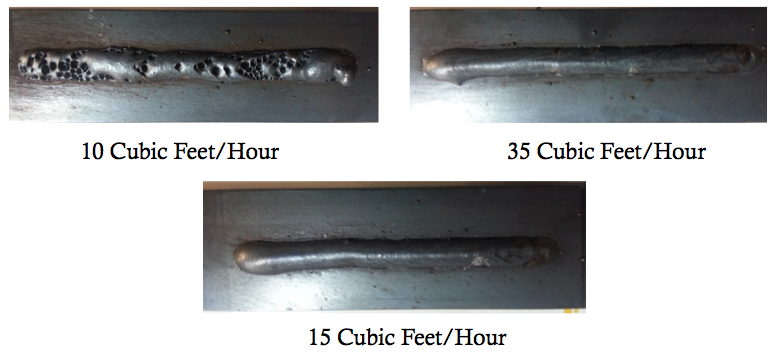
This is an image of the resulting welds. Each weld was taken at
a different gas flow rate. At 10 cf/h, you can see how bad the
oxidation is. Also notice that the 15 and 35 cf/h samples are quite
similar, showing that the extra 20 cubic feet per hour are not
necessary to produce an acceptable weld with no oxidation.
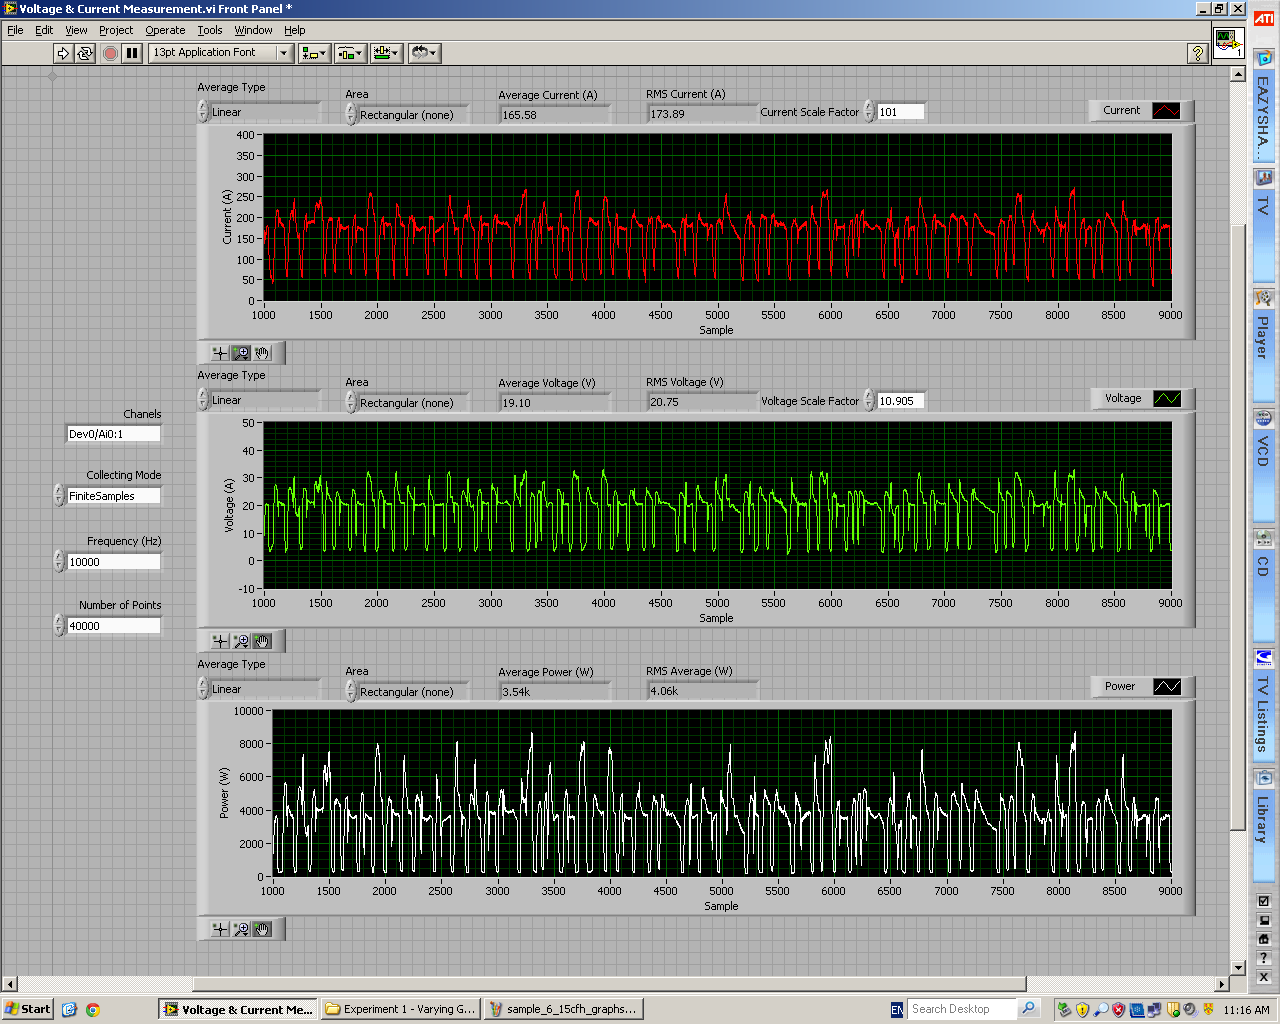
This is what the raw data looks like (ie. not particularly useful). We used LabVIEW to interface with the welder's power supply and dumped the data to a text file for further analysis in Matlab.
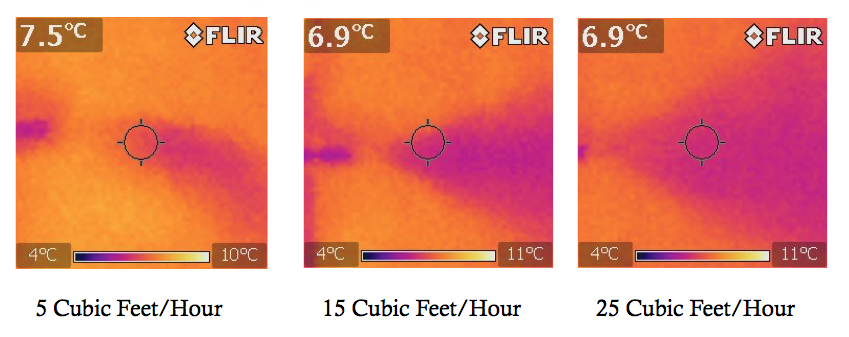
These images were taken using an infrared camera. When gas leaves the nozzle, it immediately expands, and gets cold as it does so, as per the ideal gas law. This allowed us to see the cones of gas at different flow rates with the "heat vision" camera.